
RAA analysis of crash data has revealed the worst intersections for casualty crashes in SA – with seven of the top 10 located in the northern suburbs.
The worst intersection for casualty crashes is the junction of Marion Road and Sturt Road, which recorded 40 crashes where at least one person was killed or injured between 2018-2022, according to the Department for Infrastructure and Transport data.
Of these, 78 per cent were attributed to vehicles approaching from Marion Road (from north or south).
Among the rest of the top 10, three intersections along Main North Road featured, as a growing northern suburbs population sees many of these intersections carrying more than 65,000 vehicles per day.
RAA Senior Manager of Safety and Infrastructure Charles Mountain said the data served as a reminder to take extra care at busy spots where traffic interacts.
“Some of Adelaide’s worst intersections for casualty crashes are some of our busiest – and we’re urging drivers to be aware of where typically a lot of serious crashes occur,” Mr Mountain said.
“But it is important to remember that these aren’t just numbers – each injury or fatality resulting from a crash has a lasting impact on the individuals involved, as well as their families and friends.”
Mr Mountain said analysing the data over a five-year period revealed trends that could be used to raise awareness among drivers or inform infrastructure improvements, some of which were already being undertaken.
“Across all of these intersections there is a very high number of rear-end crashes at peak-hour times, indicating the heavy traffic congestion is leading to these types of incidents.
“And at the Marion Road / Sturt Road intersection, for example, there have been a high number of right turn casualty crashes in the last five years (20).”
Mr Mountain also said that of the 18 intersections that have seen 20 or more casualty crashes over the last five years, three of them are on the remaining 10km section of the North-South Corridor (T2D), highlighting the opportunity to significantly improve safety as part of this project.
“It is good to see that five of the top 10 casualty crash intersections have either recently been upgraded, or have a planning study or impending upgrade in the works.
“The second-worst intersection of Main North Road / Regency Road, for example, is currently undergoing planning discussions, which we look forward to seeing the outcome of,” Mr Mountain said.
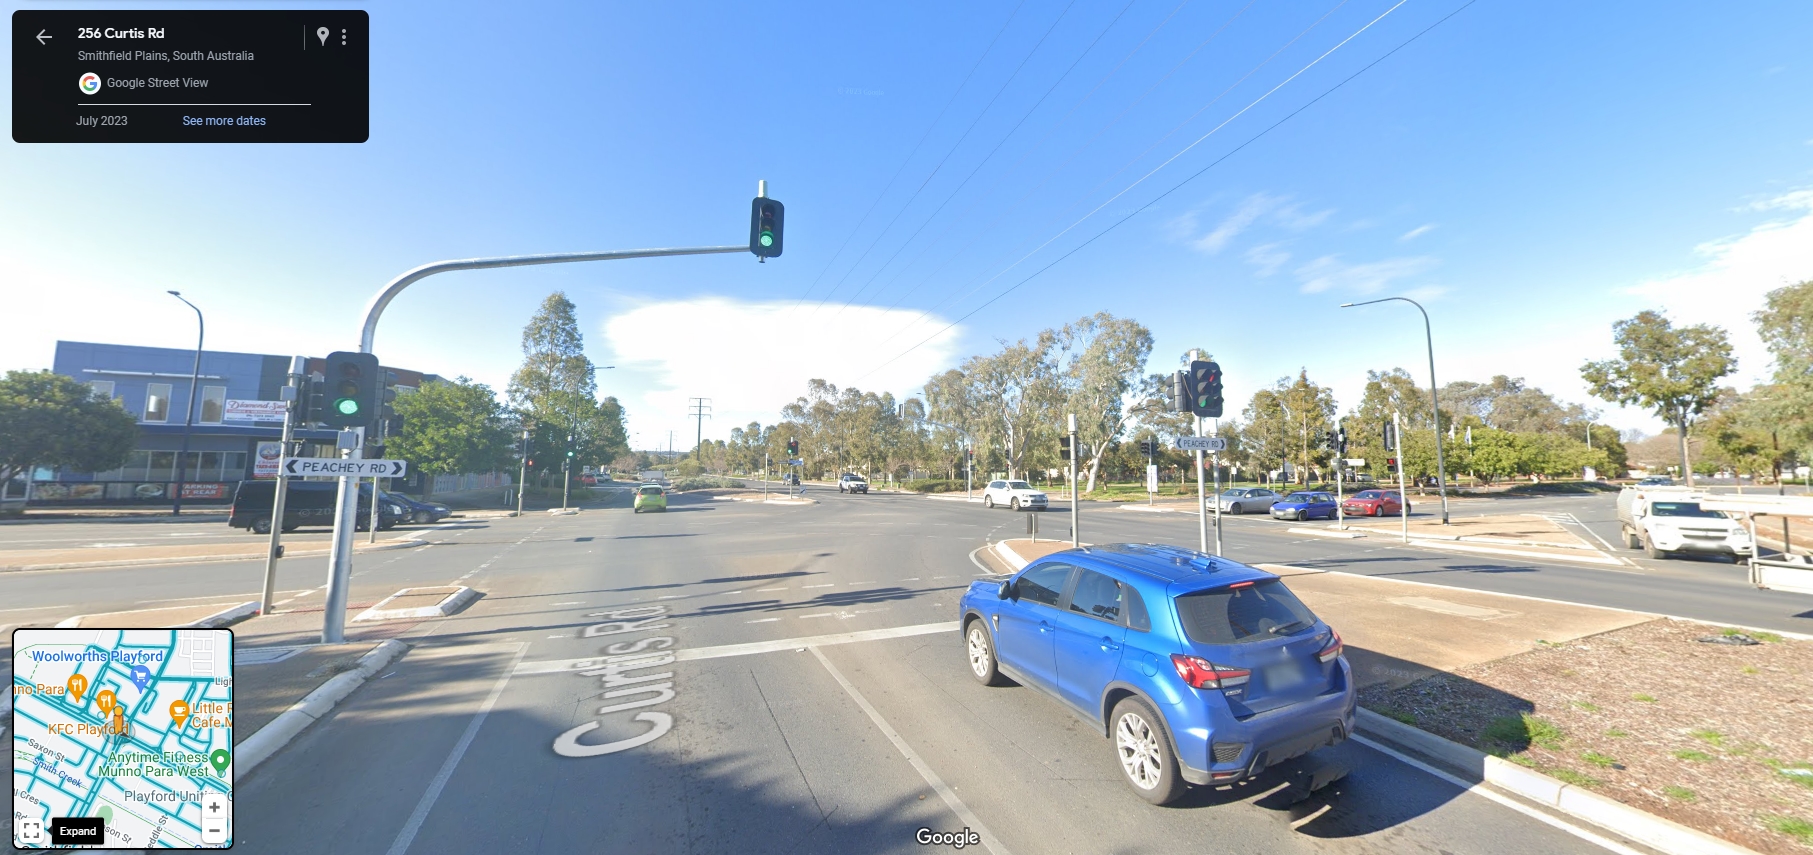
“Since 2021, we’ve also seen works undertaken at Curtis Road / Peachey Road, Briens Road / Grand Junction Road / Hampstead Road, and Stebonheath / Womma Road intersections, which are all positive improvements.
“RAA has previously advocated for further upgrades to be made to Curtis Road, to both improve safety and relieve congestion in the northern suburbs, as part of our annual state budget submissions.
“Other intersections south of the city will greatly benefit with the major works on South Road as part of the T2D project.”
| Rank | Intersection | Total casualty crashes 2018-22 | AADT |
| 1st | Marion Rd / Sturt Rd | 40 | 77,900 |
| 2nd | Main North Rd / Regency Rd** | 33 | 68,700 |
| 3rd | Curtis Rd / Peachey Rd* | 33 | N/A |
| 4th | Britannia Roundabout (Fullarton Rd/Kensington Rd) | 27 | 60,700 |
| 5th | Stebonheath Rd / Womma Rd* | 26 | N/A |
| 6th | Main North Rd / Montague Rd | 26 | 67,100 |
| 7th | Briens Rd / Grand Junction Rd / Hampstead Rd* | 25 | 62,600 |
| 8th | Main North Rd / Grand Junction Rd / Port Wakefield Rd | 24 | 83,700 |
| 9th | Bridge Rd / McIntyre Rd | 24 | 59,750 |
| 10th | South Rd / Richmond Rd** | 22 | 70,550 |
| 11th | South Rd / Daws Rd** | 22 | 75,050 |
| 12th | The Grove Way / The Golden Way** | 22 | 42,100 |
| 13th | Marion Rd / Cross Rd** | 22 | 54,350 |
| 14th | South Rd / Henley Beach Rd** | 21 | 74,350 |
| 15th | Marion Rd / Henley Beach Rd | 21 | 46,950 |
| 16th | Main North Rd / Philip Hwy / Yorktown Rd | 20 | 66,950 |
| 17th | Main North Rd / Kings Rd / McIntyre Rd* | 20 | 75,650 |
| 18th | Fullarton Rd / Kitchener St / Claremont Ave | 20 | N/A |
Notes: